Authors: RK Sahni1, A Patel2, Manoj Kumar1, DS Thorat1 and Vijay Kumar1
1Scientist, 2SRF
ICAR-Central Institute of agricultural Engineering, Bhopal-462038
Introduction
India ranks second in the world as far as farm production is concerned but the economic contribution of agriculture to India's GDP is declining continuously with the country's broad-based economic growth. In India, 63 per cent holdings are less than 1 ha accounting for 19 per cent of the total operated area whereas; over 86 percent holdings are less than 2 ha accounting for nearly 40 per cent of the total area. Fragmentation of farm holdings is major concern in this respect and the average size of holdings has shrunk from 2.82 ha in 1970-71 to 1.1 ha in 2010-11.
India ranks second in production of wheat and rice and third in pulses, sugarcane, vegetables, root and tuber crops, coconut, dry fruits, agriculture-based textile raw materials, inland fish and eggs (Singh et al., 2015). India produced 275.11 million metric tonnes (MT) of food grains during 2016-17 breaking all the earlier records. Table 1 shows the production achieved in different crop from 1950-51 to 2017-18.
Table 1: Production of crops (in million tonnes)
| Year | Rice | Wheat | Coarse cereals | Pulses | Total food grains |
| 1950-51 | 21 | 6 | 15 | 8 | 51 |
| 1960-61 | 35 | 11 | 24 | 13 | 82 |
| 1970-71 | 42 | 24 | 31 | 12 | 108 |
| 1980-81 | 54 | 36 | 29 | 11 | 130 |
| 1990-91 | 74 | 55 | 33 | 14 | 176 |
| 2000-01 | 85 | 70 | 31 | 11 | 197 |
| 2010-11 | 96 | 87 | 43 | 18 | 244 |
| 2016-17 | 110 | 99 | 44 | 23 | 275 |
| 2017-18* | 112 | 99 | 45 | 25 | 280 |
The motivation to mechanize farming activities is primarily driven by a wish to increase a family’s food security, increase household income, or improve the quality of life. Farmers may fully use custom hiring services and reap significant economic and social benefits. The economic benefits will include increasing the efficiency of man power, reduction in input costs, increasing the net cultivated area, undertaking timely operation, improving the quality of cultivation, increasing farm output, adopting crop diversification, reduction in harvesting and post-harvesting losses, and earning income through hiring farm-power services to others. The social benefits include reduction in workloads and drudgery (especially for women workers), improving safety and encouraging young generation and innovative people to remain in rural areas and work at farm. Farm mechanization saves inputs like seeds up to 15-20 per cent, fertilizers by 15-20 per cent and increases cropping intensity by 5-20 per cent. It increases the efficiency of farm labour and reduces time of agricultural operation by 15-20 per cent.
Mechanization has been identified as a key tool to increase the agricultural production. Table 2 shows the share of agriculture in GDP and farm mechanization level in different countries.
Table 2: Agriculture GDP and level of farm mechanization in different countries
| Country | Agricultural GDP (%) | Level of mechanization (%) |
| USA | 1 | 95 |
| Western Europe | <5 | 95 |
| Russia | 4 | 80 |
| Brazil | 5 | 75 |
| China | 10 | 48 |
| India | 14 | 40 |
The agricultural sector in India has been depended on cheap and surplus labour for the long time. Now, the situation is changing with more opportunities available in factories and services as well as the Government’s rural employment creation program, which provides 100 days of employment on public related work projects. Labour shortage problems are being faced by farmers during peak seasons due to the enactment of the National Rural Employment Guarantee Act. Labours are available at a higher cost and this increases the demand for mechanization. It has been observed that the percentage of agricultural workers to the total workers has been steadily declining from 59.1 per cent in 1991 to 54.6 per cent in 2011 and expected to further decline to 25.7 per cent by 2050 leading to severe farm labour shortage (Table 3).
Table 3: Population Dynamics of Indian workers and farm labour shortage
| Population Dynamics of Indian Agricultural Workers (No in Million) | |||||
| Particulars | 1991 | 2001 | 2011 | 2020 | 2050 |
| Country's Population | 846.4 | 1,028.7 | 1,210.7 | 1,323 | 1,612 |
| Total Number of Workers | 313.7 | 402.2 | 481.7 | 566 | 787 |
| Workers’ Percentage of Population | 37.1% | 39.1% | 39.8% | 42.8% | 48.8% |
| Number of agricultural workers | 185.3 | 234.1 | 263 | 230 | 202 |
| Including: Cultivators | 110.7 | 127.3 | 118.7 | 110 | 000 |
| Including: Agricultural Labours | 74.6 | 106.8 | 144.3 | 120 | 000 |
| Agricultural Workers’ percentage of Total Number of Workers | 59.1% | 58.2% | 54.6% | 40.6% | 25.7% |
The agriculture sector has witnessed a substantial decline in use of animate power (animal and human power) in agriculture activities. The role of tractors in India reveals the increasing trend of tractorization in the country (Table 4). Custom hiring of farm equipment is a prevalent practice in India, particularly among small farmers for whom ownership of large equipment is expensive and uneconomical. Given the agricultural worker scarcity and the launch of several Government programs, the adoption of farm mechanization is going to increase in future.
Table 4: Aspects of Indian agriculture (1960-2010)
| Item | 1960 | 1970 | 1980 | 1990 | 2000 | 2010 |
| Agricultural land (Mha) | 133 | 140 | 140 | 143 | 143 | 142 |
| Irrigation pumps (million) | 0.4 | 3.3 | 6.2 | 12.9 | 19.5 | 25 |
| Irrigated area (%) | 19 | 22 | 28 | 33 | 34 | 35 |
| Cropping intensity | 1.15 | 1.18 | 1.23 | 1.30 | 1.33 | 1.39 |
| Fertilizer use (kg/ha) | 2 | 15 | 39 | 88 | 125 | 150 |
| Grain yield (kg/ha) | 700 | 860 | 1000 | 1300 | 1600 | 1900 |
| Tractors (thousands) | 37 | 146 | 531 | 1200 | 2600 | 4000 |
| Area per tractor (ha) | 3600 | 960 | 260 | 120 | 55 | 36 |
| Power tillers (thousand) | 0 | 9.5 | 16 | 31 | 100 | 155 |
| Draft animals (million) | 80.4 | 82.6 | 73.4 | 70.9 | 60.3 | 50 |
The technological advancement in Indian agriculture since mid-sixties has brought revolutionary increment in farm production. The country observed astonishing growth in that helped country to proceed from hunger to self-sufficiency in food grains by increasing the food grain productivity from 0.636 t/ha in year 1965-66 to 2.111 t/ha in 2013-14. This growth is primarily due to the use of advanced technology during green revolution period, which is supported by agricultural scientists including agricultural engineering, positive Govt. policy, and hard work of farmers and manufacturers of farm machinery. The increased use of inputs in farm necessitated to improve their use efficiencies though mechanization of most of the farm operations. The timeliness in operations helped in obtaining optimal yields from different crops, which has been only possible by utilizing farm machineries.
Table 5 shows that the cropping intensity is increasing with increase in per unit power availability. It was 114 per cent during 1965-66 with power availability of 0.32 kW/ha and increased to about 142 per cent in 2013-14 with power availability of 2.02 kW/ha. The adoption and utilization of package of farm machinery and technology for farm mechanization has significantly contributed to increase the cropping intensity and farm produce during the last 50 years and its positive relationship with availability and growth of farm power is depicted in the Fig.1.
Table 5: Cropping intensity and power availability on Indian farms
| Year | Cropping Intensity (%) | Food grain Productivity (t/ha) | Power available (kW/ha) | Power per unit Production (kW/t) | Net sown area per Tractor (ha) |
| 1965-66 | 114.00 | 0.636 | 0.32 | 0.50 | 2162 |
| 1975-76 | 120.30 | 0.944 | 0.48 | 0.51 | 487 |
| 1985-86 | 126.80 | 1.184 | 0.73 | 0.62 | 174 |
| 1995-96 | 130.80 | 1.499 | 1.05 | 0.70 | 82 |
| 2005-06 | 135.90 | 1.715 | 1.49 | 0.87 | 45 |
| 2010-11 | 140.50 | 1.930 | 1.78 | 0.92 | 34 |
| 2011-12 | 141.50 | 2.079 | 1.87 | 0.90 | 31 |
| 2012-13 | 140.90 | 2.129 | 1.94 | 0.91 | 29 |
| 2013-14 | 142.00 | 2.111 | 2.02 | 0.96 | 27 |
Correlation between farm power availability and food grain productivity
Food grains productivity is positively associated with farm power availability. Food grains productivity and farm power availability has been increased from 0.710 t/ha to 2.21 t/ha and 0.296 kW/ha to 2.02 kW/ha for the period 1960-61 to 2013-14 (Fig.1).
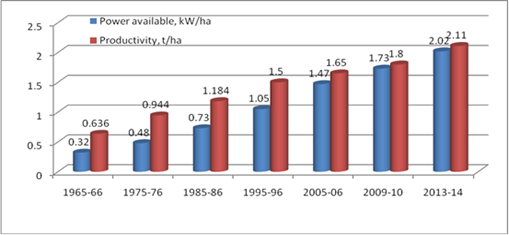
Fig. 1: Farm power availability and food grain productivity from 1965-66 to 2013-14.
The overall mechanization level in India is only 40-45 per cent in which 90 per cent of the total power is contributed by mechanical and electrical power sources. One of the major constraints of increasing farm production and productivity is the inadequacy of farm power and machinery with farmers. The average farm power availability needs to be improved to a minimum of 2.5 kW/ha by 2020 to assure timeliness and quality in field operations and to undertake heavy field operations like sub-soiling, deep ploughing, chiseling, etc..
Currently, India is one of leading country in the world for the manufacture of tractor, agricultural implements and equipment. The range of equipment includes land development machinery, field preparation equipment, plant protection machines, harvesting and threshing equipment, irrigation and drainage pumps, sprinkler systems, dairy and agro-processing equipment etc. India is exporting these implements to various countries including USA and countries in Africa and Asia continents.
In India, medium and large scale industries manufacture tractors, power tillers, diesel engines, electric motors, land development machinery, field preparation equipment, weeders, sprayers and dusters, irrigation pumps, post-harvest and processing machinery and dairy equipment. In India, there are 22 tractor, 5 power tiller, 200 diesel engine, 600 irrigation pump, 48 combine and 188 earthmoving machinery manufacturers (Table 6). The marketing and popularization of these machinery is done through their network of dealerships, therefore, these manufacturers are able to provide effective after-sales service to the users. These industries improve their product and development technologies through their own R&D efforts and through technological support from external agencies.
Table 6: Status of farm mechanization industry in India
| Equipment manufacturers | Number of units |
| Agricultural tractors | 22 |
| Power Tillers | 5 |
| Irrigation Pumps | 600 |
| Plant Protection Equipment | 300 |
| Combine Harvesters | 48 |
| Reapers | 60 |
| Threshers | 6,000 |
| Seed Drills and Planters | 2,500 |
| Diesel Oil Engines | 200 |
| Plough, Cultivators, Harrows | 5,000 |
| Chaff Cutters | 50 |
| Rural Artisans | >1 Mn |
The overall level of farm mechanization in India is 40-45 per cent (i.e. tillage about 40 per cent, seeding and planting about 30 per cent, plant protection 35-45 per cent and harvesting and threshing about 60-70 per cent for rice and wheat and less than 15 per cent for other crops). The level of farm mechanization varies greatly region to region. Northern states such as Punjab, Haryana and western Uttar Pradesh have high level of mechanization (70-80 per cent overall; 80-90 per cent for rice and wheat) due to high productive land as well as declining number of agriculture workers and also full support by state government. The eastern and southern states have lower level of mechanization (35-45 per cent) due to smaller and scattered land holdings. In the north-eastern states, the level of farm mechanization is extremely low mainly due to hilly topography, high transportation cost, and socio-economic conditions of the farmers.
Conclusion
The farm mechanization has been well-received throughout the world as one of the most important elements of modernizing agriculture. The level and appropriate selection of agricultural machinery has direct impact on land and labour productivity, farm output and income, environmental safety and the quality of life of farmers in India. Agricultural machines also ensure timeliness of farm operations and increase work output per unit time. Suitability to small and medium farms, simple design and technology, versatility for use in several farm operations, affordability in terms of cost and profitability and most importantly, repair and maintenance services are the basic requirement for the expansion of farm mechanization.
References:
1. Agricultural Statistics at a Glance, 2016
2. Anonymous, 2015. Transforming Agriculture through Mechanization: A knowledge paper on Indian Farm Equipment Sector. FICCI, New Delhi, India.
3. Singh, Kanchan K. 2015. Changing Scenario of Farm Mechanization in India. Agricultural Machinery Manufacturers' Meet (AMMM) - 2015. Held at Hotel Le Meridien, Coimbatore during July 17-18.
4. Singh R S; Singh Surendra; Singh S P. 2015. Farm power and machinery availability on Indian farms. Agricultural Engineering Today, 39(1): 45-56.
5. Vision 2050 Document of Central Institute of Agricultural Engineering, Bhopal, 2015
6. World Bank indicators, CIA fact book, Mechanization and farm technology division of department of agriculture and cooperation, trading economics, FAO Year book 2013.
About Author / Additional Info: